GA4 Reports: A Comprehensive Guide to Acquisition, Conversions, and More
Before GA4, there was….
….UA….
And, before UA, there was….
…GA….
And, before GA, there was….
….Urchin?
Okay… Seriously, I have no idea who’s in charge of naming stuff at Google. But here we are.
Google Analytics 4 (GA4) as an analytics tool for website and app performance.
GA4 is set to replace Universal Analytics, which is the current generation of Google Analytics software used by 86% of websites on the Internet with traffic analysis tools installed.
In the digital marketing world, it’s like the new model of your favorite car. The response is split. Some marketers love it. Some hate it.
But we’re all going to have to take it for a spin because UA is set to sunset in July of 2023 and GA4 will replace it permanently.
In this guide, we’re going to dive deep into GA4 reports — covering the metrics, conversions, visualizations, and more.
Understanding how to master the Reports tab in GA4 is essential for anyone whose work involves marketing campaigns, SEO, website engagement and retention, e-commerce, or just about anything else you’d want to track.
Understanding the GA4 Reports Tab
First, let’s get oriented.
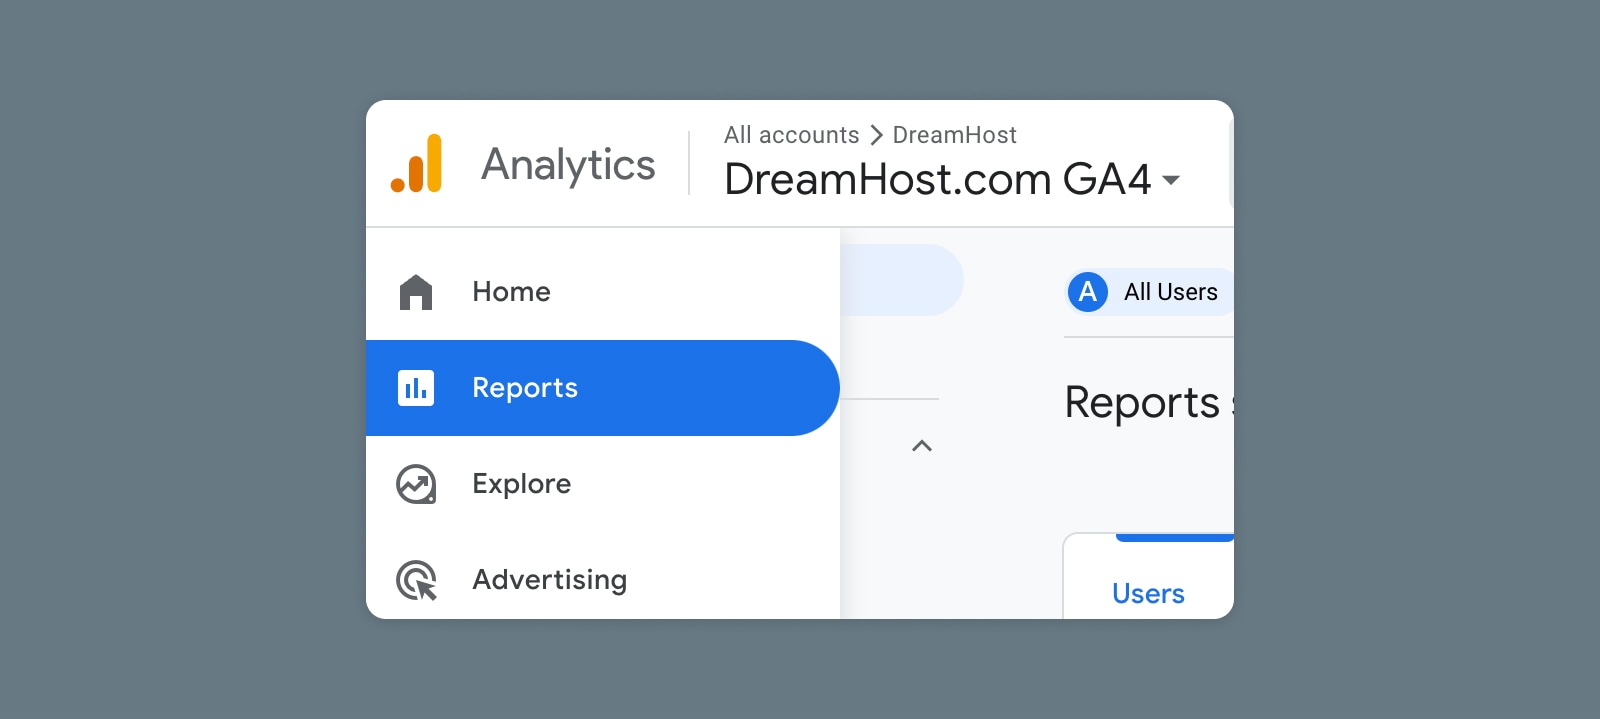
GA4 Reports tab is the central hub for accessing and analyzing data in a GA4 property.
These are the reports available in GA4:
- Reporting Snapshot
- Realtime
- Acquisition
- Overview
- User Acquisition
- Traffic Acquisition
- Engagement
- Overview
- Events
- Conversions
- Pages and Screens
- Landing Page
- Monetization
- Ecommerce Purchases
- In-App Purchases
- Publisher Ads
- Promotions
- Retention
- Demographics
- Overview
- Demographic Details
- Tech
- Overview
- Tech Details
In this guide, we’ll walk through each section and explore how you may use the data to inform marketing campaigns, ad spend, and more.
But before we get into the weeds, it’s important to note that you can break down all of the reports into two main types:
- Overview Reports: high-level summary of key metrics (e.g., user acquisition, engagement rate, event count)
- Detail Reports: specific dimensions and metrics for detailed analysis (e.g., demographics, device category, event name)
GA4 also offers some new report features such as path exploration and exploration reports, but we’ll cover those in a separate guide.
For this article, we’ll work our way straight down the list of reports along the left menu.
Get Content Delivered Straight to Your Inbox
Subscribe to our blog and receive great content just like this delivered straight to your inbox.
Reporting Snapshot
If you’re looking for the quickest sense of how your website is performing, then you can pop right into the Reporting Snapshot.
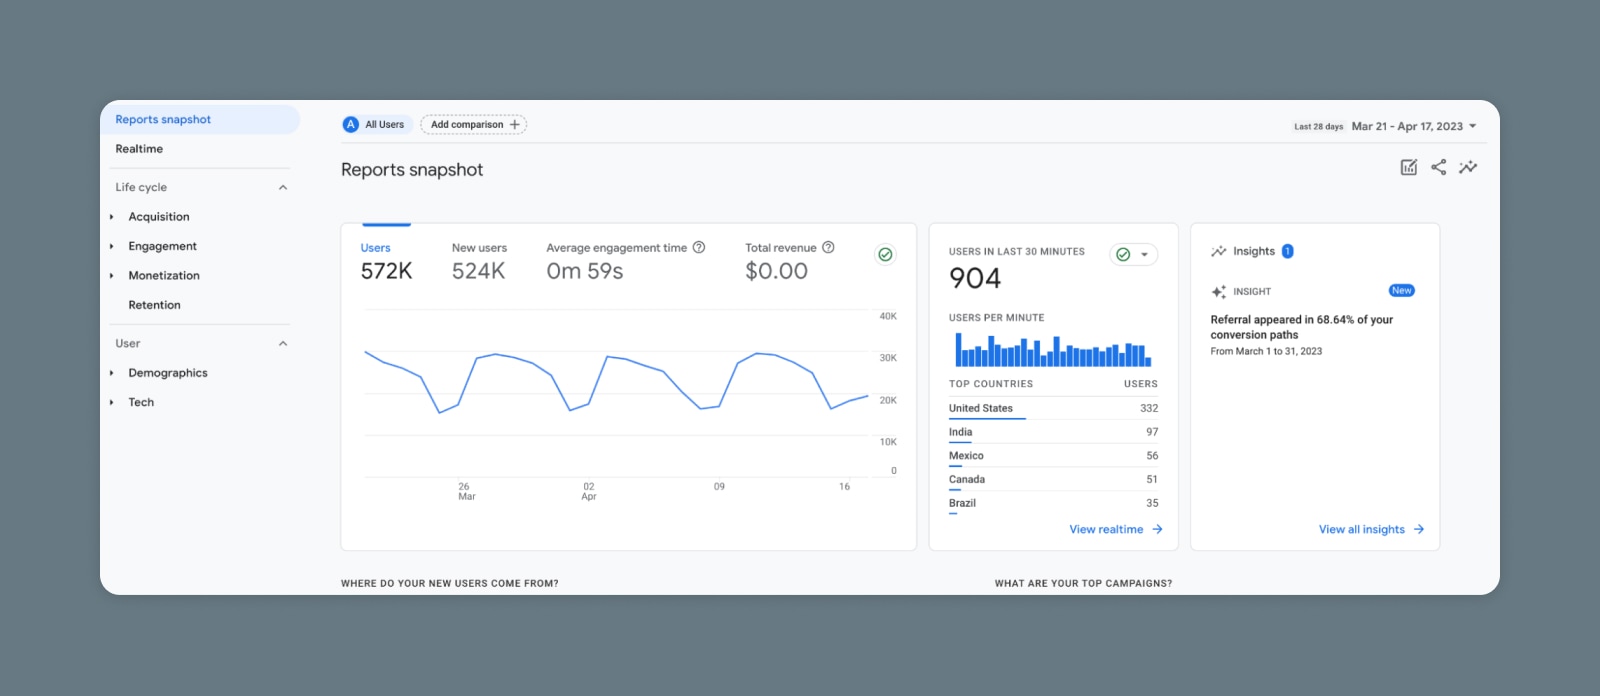
You can think of this page as a pre-built analytics dashboard.
It blends data from all of the other reports into a single view that gives you a general sense of how much traffic you’re receiving, where your traffic is coming from, and what actions users are taking on your website.
Real-Time Reporting in GA4
Realtime reports in GA4 work almost the same way as they did in Universal Analytics. You can get a real-time snapshot of the users on your website over the last 30 minutes.
You’ll see key data such as:
- Active users
- Top active pages
- Top events
- Geographic data
The realtime report is a cool way to see what’s happening right this second. But if you want to dive into a more comprehensive analysis, understand behavior across a user’s life cycle, or compare metrics across different date ranges, then you’ll need to dig into the relevant reports below.
Acquisition Reports
Acquisition is about understanding how users got to your website.
Inside the acquisition section, you’ll see 3 different reports.
1. Acquisition Overview
The Overview report is similar to the Snapshot above but looks only at metrics related to acquisition. You can see a combination of data about the way users find your website plus which channels or campaigns are driving the most traffic.
2. User Acquisition
The User Acquisition report filters your traffic to only look at how New Users arrived at your website for the first time. This is helpful if you want to better understand how people are learning about your website and help you with digital marketing attribution.
Basically: How did people find us in the first place?
For instance, you may be wondering: Do more people find our website through Instagram and then click on an ad? Or do they click on the ad first and then find us through Instagram?
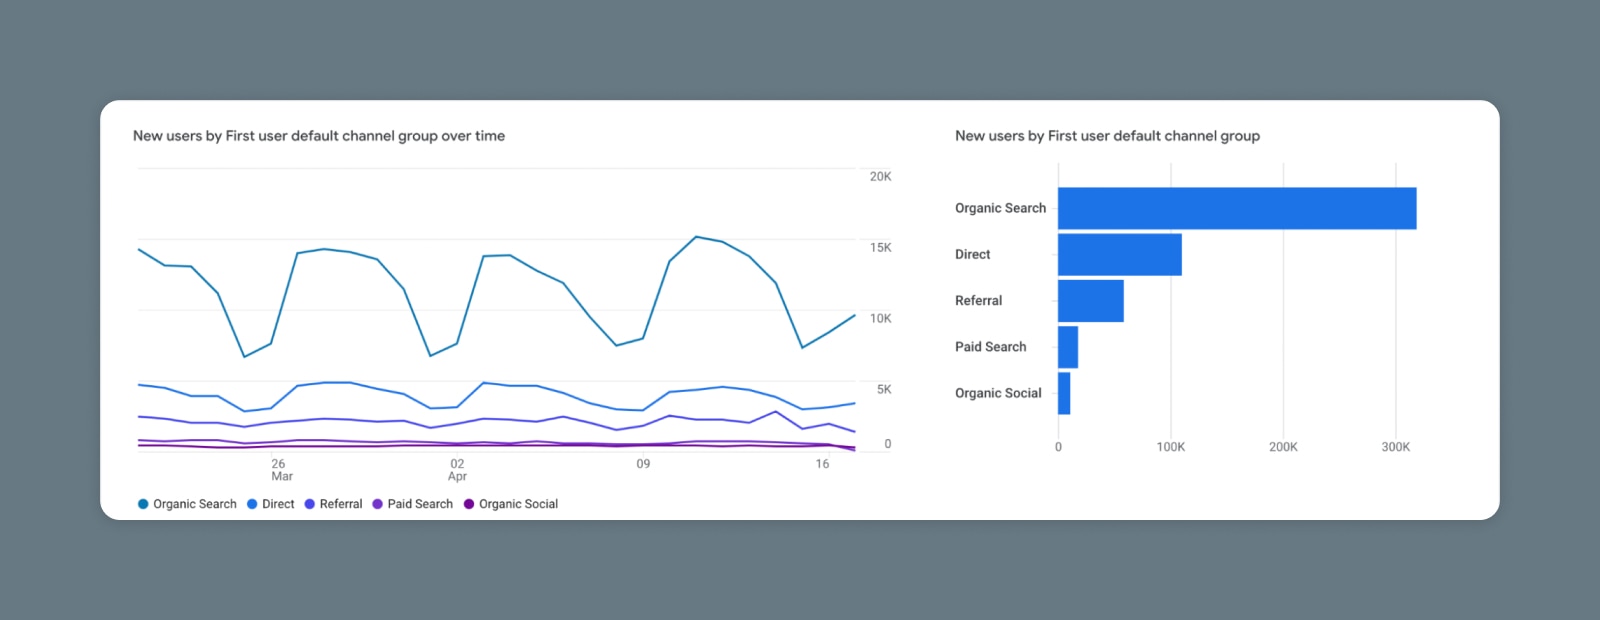
The default view for the User Acquisition report would help you answer that question by showing you the First User interaction by default channel group.
You can also toggle this report by clicking the dropdown and grouping acquisition by other dimensions like Source, Medium, or Campaign.
3. Traffic Acquisition
This report shows much the same data as User Acquisition, but it isn’t filtered to show only New Users. Instead, it allows you to see the source or channel that drove traffic to your website – regardless of whether it’s that user’s first visit or their hundredth.
The default channel grouping will break down your traffic into buckets like referral traffic from other websites, organic traffic from search engines, paid search ads, email marketing, and other common buckets.
Organic Search
Organic search describes the unpaid results in the Search Engine Results Pages (SERPs). These are ranked only by a search engine’s algorithm.
Read MoreEngagement Reports
So now we know where the traffic is coming from. But what do they do once they get to our website?
That’s what Engagement Reports are all about.
This data will help you answer key questions like:
- Which content was most popular on your website?
- Which links did people click on?
- How many users completed goals or purchases?
- Which pages brought people to the website in the first place?
Basically, we’re about to turn this analytics get-together into an analytics party.
1. Overview
As expected, the Overview is once again like a snapshot of the data shown below.
Here you can get a high-level summary of the details you’ll find in the subsequent reports.
2. Events Report
Events report is where the magic happens.
Here you’ll be able to see granular data about the actions your website visitors are taking.
By default, you’ll see things like page_view, scroll, click, first_visit, and more.

(“Page Views” are considered an event on GA4.)
You can create up to 50 custom GA4 events to track things like sign-ups, subscriptions, or other actions.
If you click on each event, you can drill down further to see more information about the actions, when and where they occurred, and other details.
3. Conversions Report
In addition to all of the events on your website, it’s likely that some of these actions represent an actual conversion that’s correlated with sales or revenue.
For instance, when a user creates an account or makes a purchase.
When you configure GA4 events, you can indicate whether each specific event should be treated as a conversion. If you mark the event as a conversion, then those events will appear in this special report.
This gives you a filtered view of the conversions that have been completed. And you can drill down to see where those conversions came from and other relevant information.
(Nerd note: In GA4, events marked as Conversions have completely replaced “Goals”.)
4. Pages and Screens
This report is similar to the “Page Views” report that you may be used to seeing in Universal Analytics.
You can quickly see which pages on your website have racked up the most views, have been visited by the most users, and have contributed the highest number of conversions.
The default report will show pages by their title, but if you are used to browsing pages by their URL, then you can change the view from the dropdown above the list of pages.
5. Landing Pages
Landing pages are the first pages that a user sees when they come to your website on any given session. It’s like if you had a massive house with dozens or hundreds (or thousands) of front doors. You may want to know which ones your guests are using.
(Because obviously, if you have a house that big, you have guests coming and going constantly.)
The Landing Page report basically tells you which door(s) your visitors use most frequently.
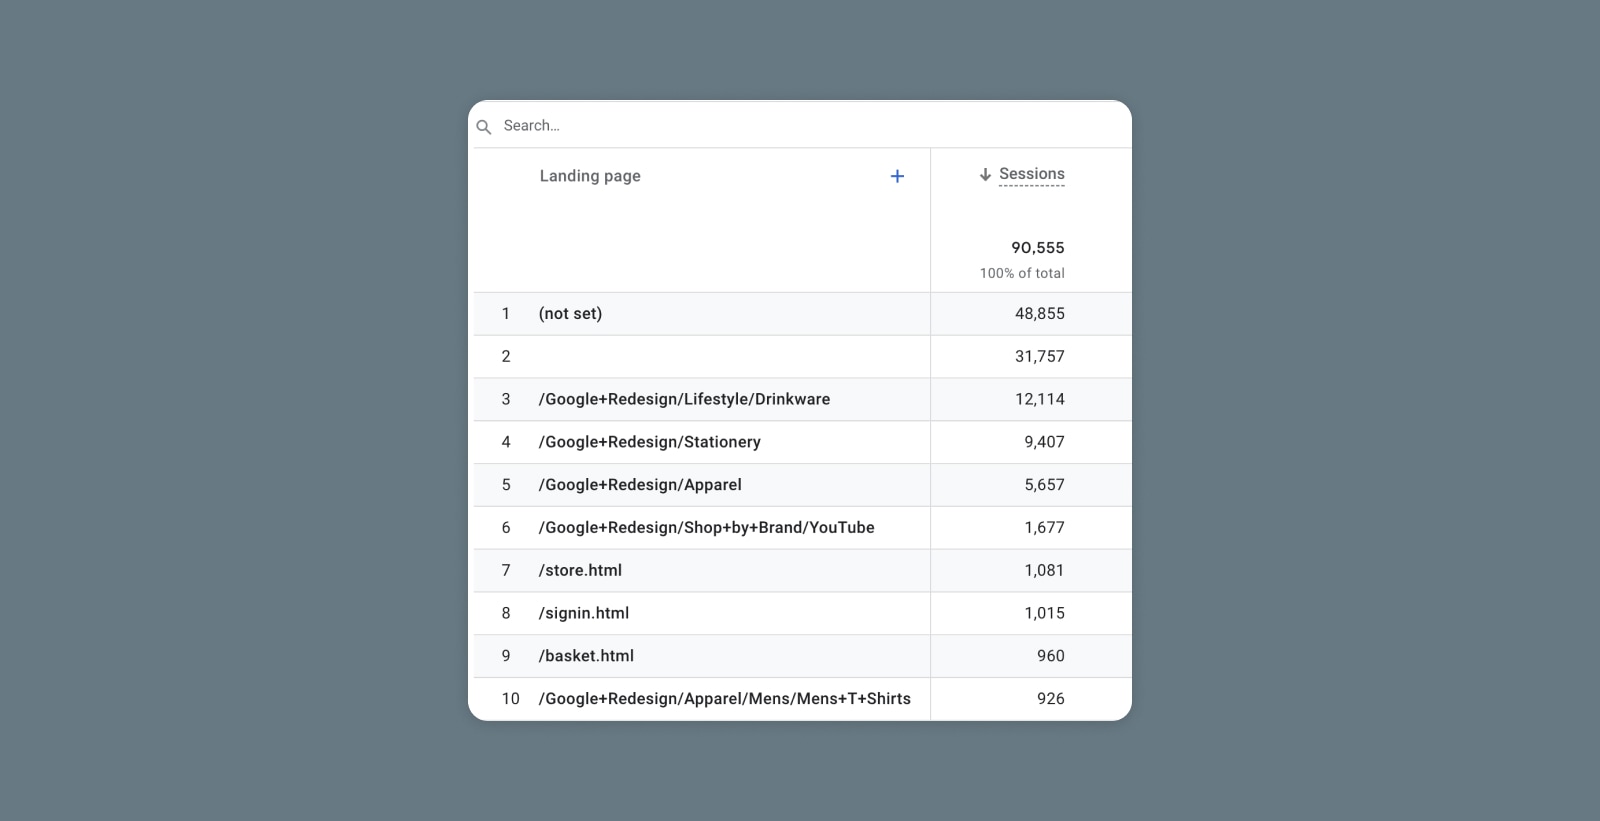
This gives you a good sense of which pages or content are most attractive to users, getting the most visibility in organic search results, or generating the most buzz on social media.
Monetization Reports
As you probably guessed by the name, Monetization Reports are built to help you understand how and where your website is generating actual revenue.
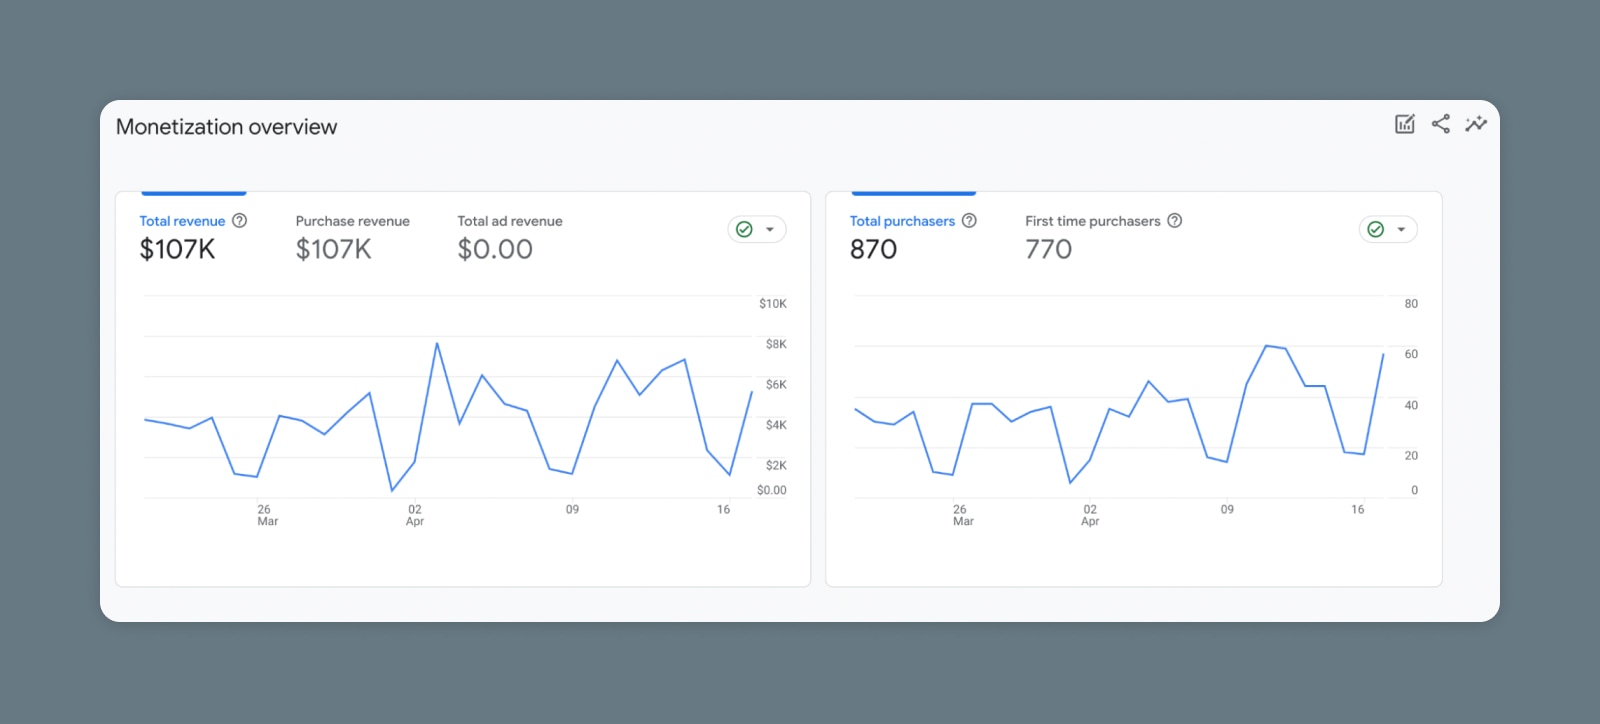
1. Overview
Get a snapshot of the revenue your website generated, the number of purchases made, the average value across your visitors, and more from the Monetization Overview report.
2. Ecommerce Purchases
If you have an e-commerce website or an online store, you should configure ecommerce tracking within GA4.
This will allow you to see all the purchases made on your website, browse your specific products to see which are most popular / generating the most revenue, and other data that will help you optimize sales and grow your business.
3. In-app Purchases
If your website or mobile app offers users the chance to make a purchase (e.g., buying extra spins on that virtual slot machine or signing up for a paid subscription to your SaaS), you can configure that action as an in-app purchase.
Then you’ll be able to use this report to see all the in-app purchases and information about who made those purchases and where they occurred.
To set this up, you’ll simply need to fire an event named “in_app_purchase” when a purchase is completed.
4. Publisher Ads
Suppose your website or mobile app is monetized with advertisements. In that case, this report will help you see how much you’re earning, which ads are generating the most revenue, and which pages are generating the most impressions and clicks on the ads.
This report integrates directly with Google Ad Manager or AdMob to generate data. If you’re using another ad network, then you’ll need to pass ad data manually.
5. Promotions
The final monetization report is the Promotions Report.
This simplifies the way that you track promotions like special offers, discounts, and coupons. Whereas you may have created custom tracking parameters and other systems in Universal Analytics, you can now directly configure specific promotions and then track their impact on revenue.
For instance, you can run a banner offering 10% off a product and then measure to see how many purchases and how much revenue that specific promotion generated.
Retention Report
Parting is such sweet sorrow.
But if your retention metrics are right, then you won’t even sweat it — You know those users will be right back.
The Retention Report gives you a simple snapshot of how many new users are visiting your website versus the number of returning users.
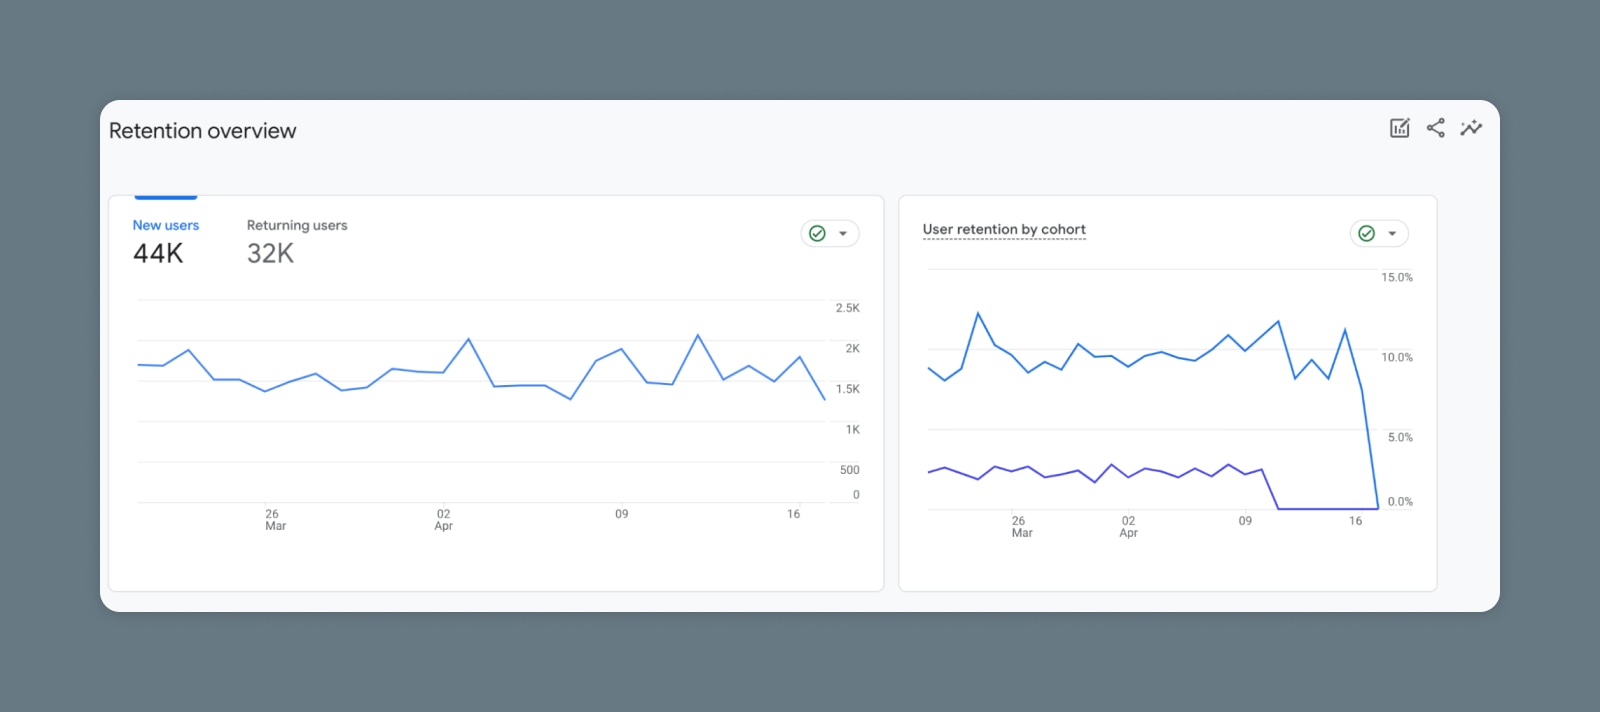
You can take it one step further by looking at retention over time, retention by cohort, and other advanced reports that help you better understand if and when users are most likely to come back to your site in the future.
Demographics Report
Do you ever wish you could just walk up and shake the hand of your website visitors and get to know them?
Well, that would be a bit creepy.
But you can at least learn a bit more about them from a distance with the Demographics Report.
1. Overview
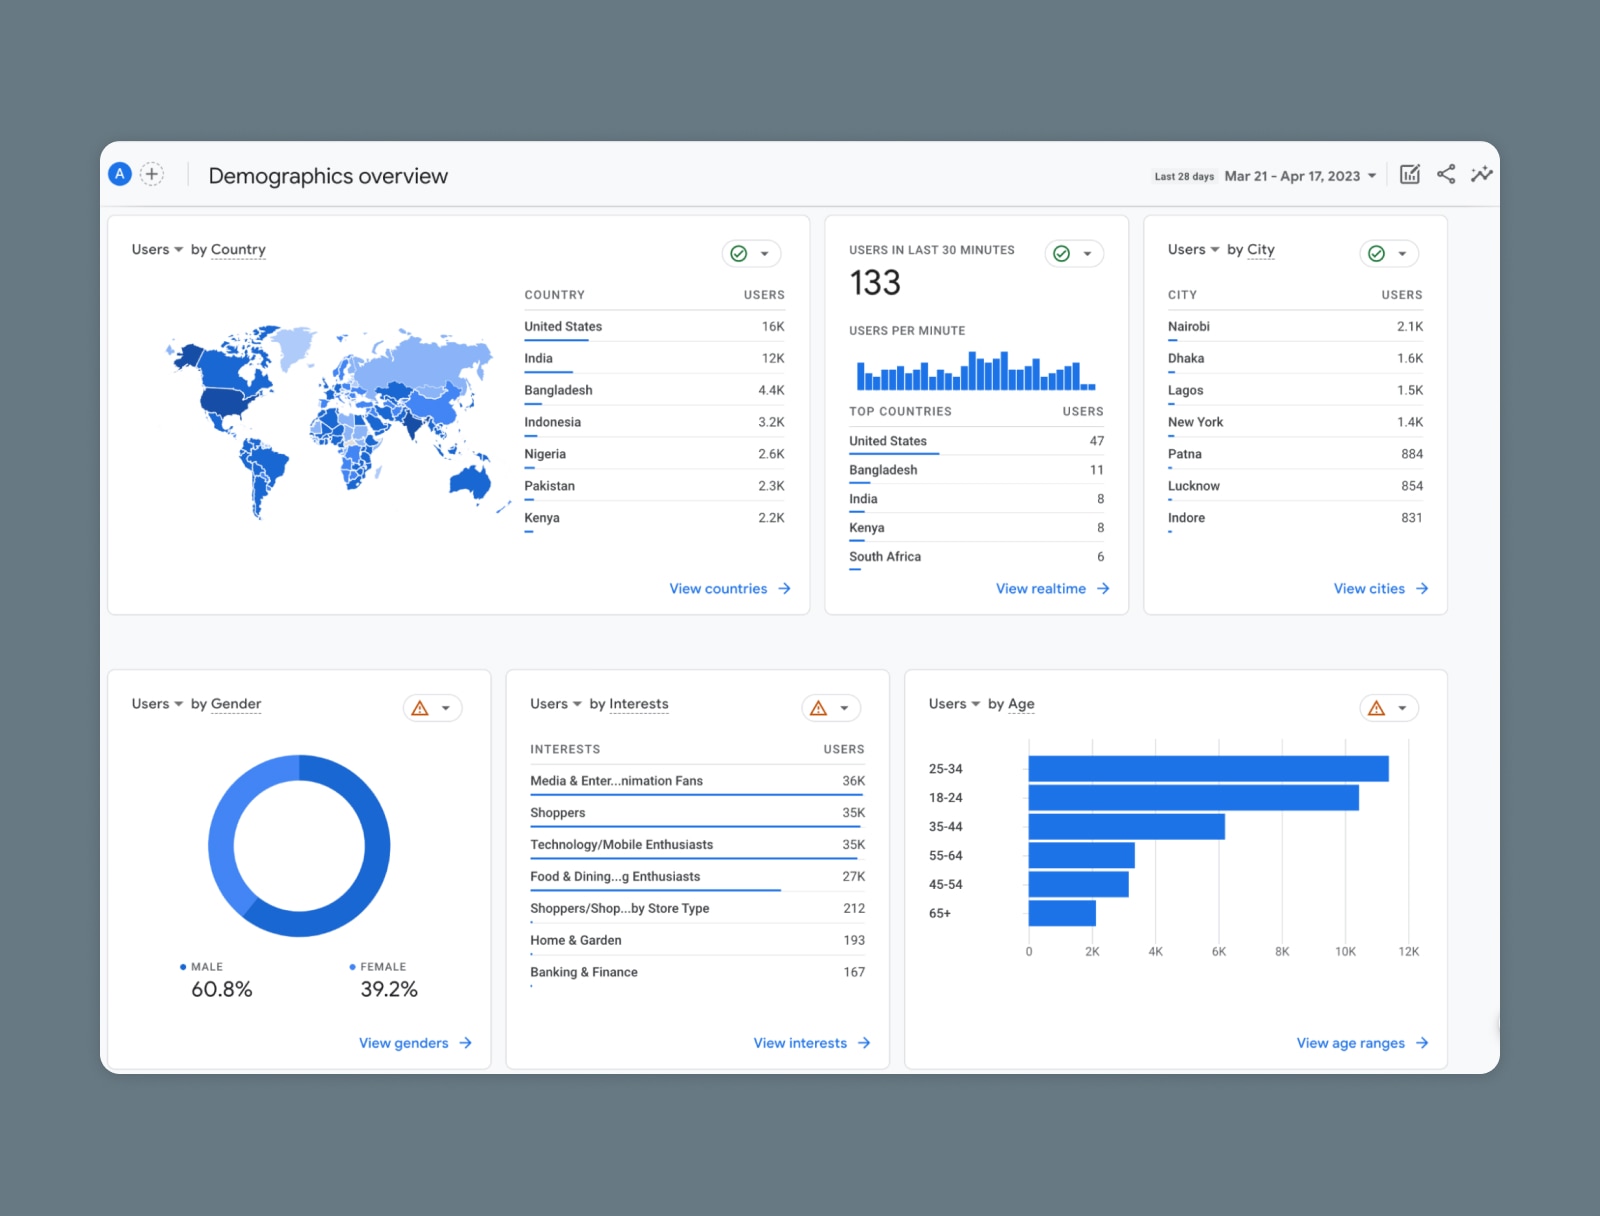
The Demographics Overview report shows you all kinds of information about the people who visit your website:
- City and Country
- Language
- Age
- Interests
- Gender
You can see if your website tends to attract visitors from certain parts of the world or if it’s more popular with men or women. This can be helpful when you’re thinking about future marketing and promotional activities.
2. Demographic Details
This report overlays the demographic data from the Overview with Engagement Report data.
Now you can see not only which groups are visiting your website most frequently, but also which groups are most engaged, make the most purchases, spend the most time on your website, and more.
Tech Report
The Tech Report shows you which devices, systems, and browsers people use when visiting your website.
Overview
The Overview shows a breakdown similar to the Demographics Report, highlighting the types of systems and devices that are used more frequently by users coming to your site.
Tech Details
The Tech Details, also similar to the Demographic Details, correlates the different technology and devices used by your website visitors with Engagement data.
You may be able to use this data to identify issues like poor site performance on certain screens or browsers.
Navigating and Customizing GA4 Reports
Now that we’ve gone around the world, let’s quickly zoom in on some ways that you can use the Reports Tab to better understand your audience and make data-driven decisions about your website and your business.
Applying Filters
Filters allow you to look at specific segments of your traffic and better understand how certain groups of users interact with your site.
To apply a filter, simply open any of the detailed reports we’ve covered in this guide.
Find the “Add filter” button under the report name and click on it.
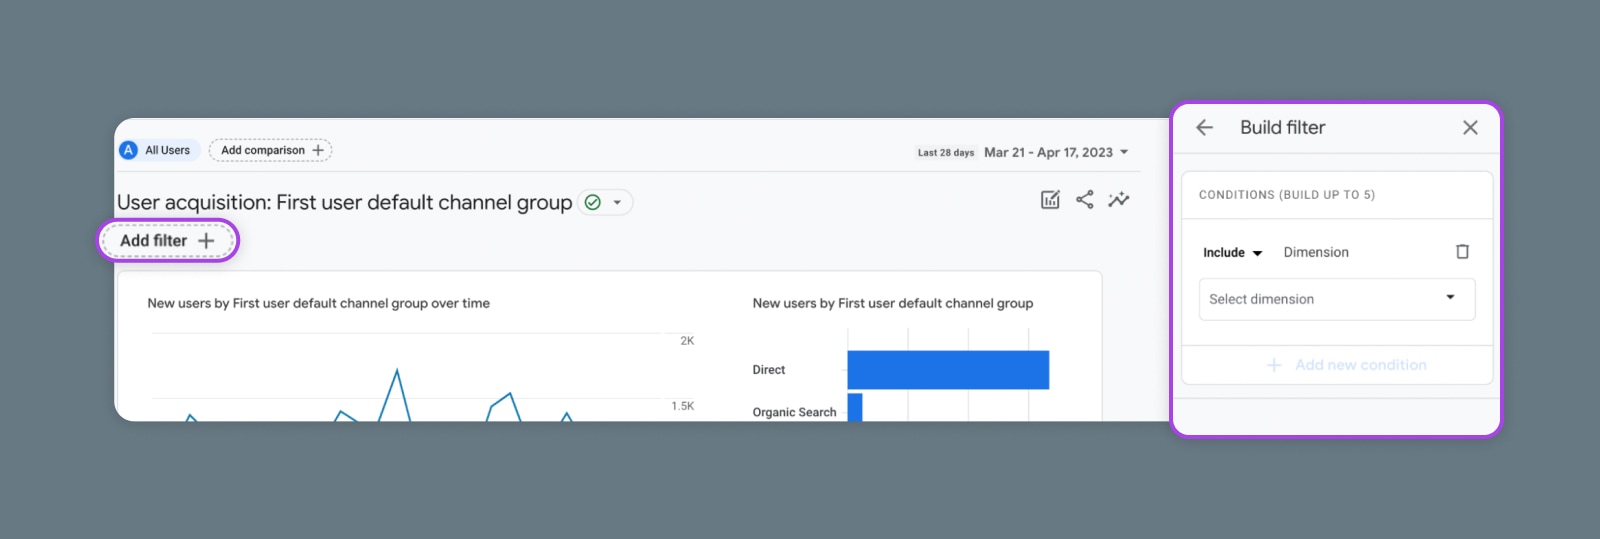
From here, you can create a custom filter based on up to 5 dimensions.
Comparisons
With comparisons, you can see how two groups interact side-by-side. For instance, you can look at how organic search traffic compares to paid search traffic.
To create a comparison from any GA4 report, simply click the “Add comparison” button above the report title.
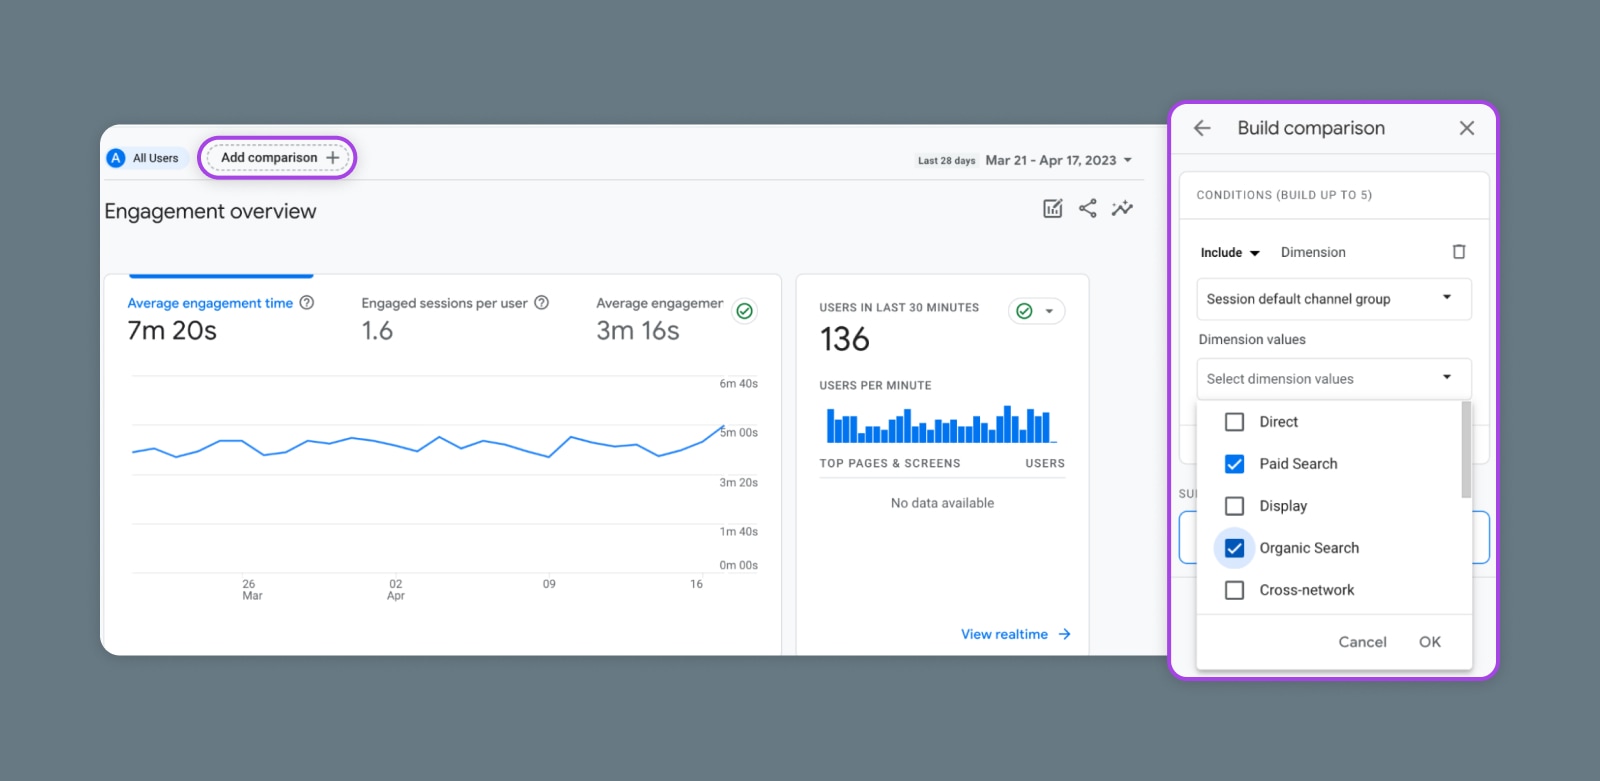
Then, configure a comparison based on the dimension you want to segment.
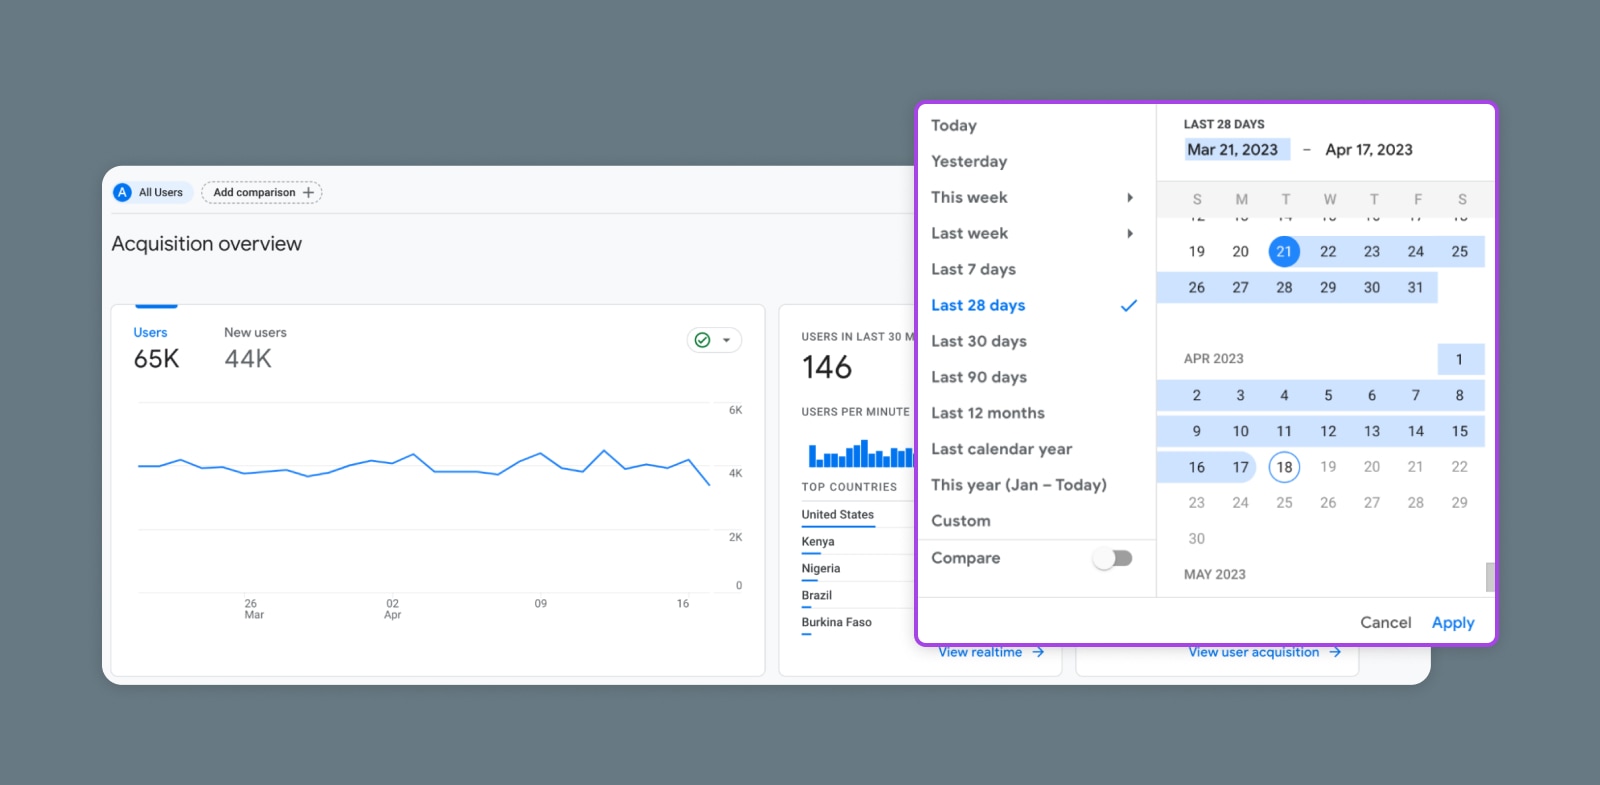
Date Ranges
Every GA4 report (except realtime reports) shows data from a specific range of time.
By default, the reports will show the Last 28 Days. But you can change the date range at any time by simply clicking on the date range shown in the top-right corner of the report and setting a new range.
Search Bar
Not finding what you’re looking for in GA4?
Try using the search bar!
At the top of the GA4 window, you’ll find a search bar where you can look for specific reports or data. You can also ask plain-language questions using the Analytics Intelligence feature.
Custom Reports
The default reports offer a lot of data, but depending on the website and the business, you may need a different concoction.
The “Custom Reports” feature is like a build-your-own sundae bar for analytics.
Choose your favorite dimensions, metrics, and filters, then mix and match to create a one-of-a-kind report. Whether you prefer a simple overview or a decadent data feast, custom reports satisfy every analytics craving.
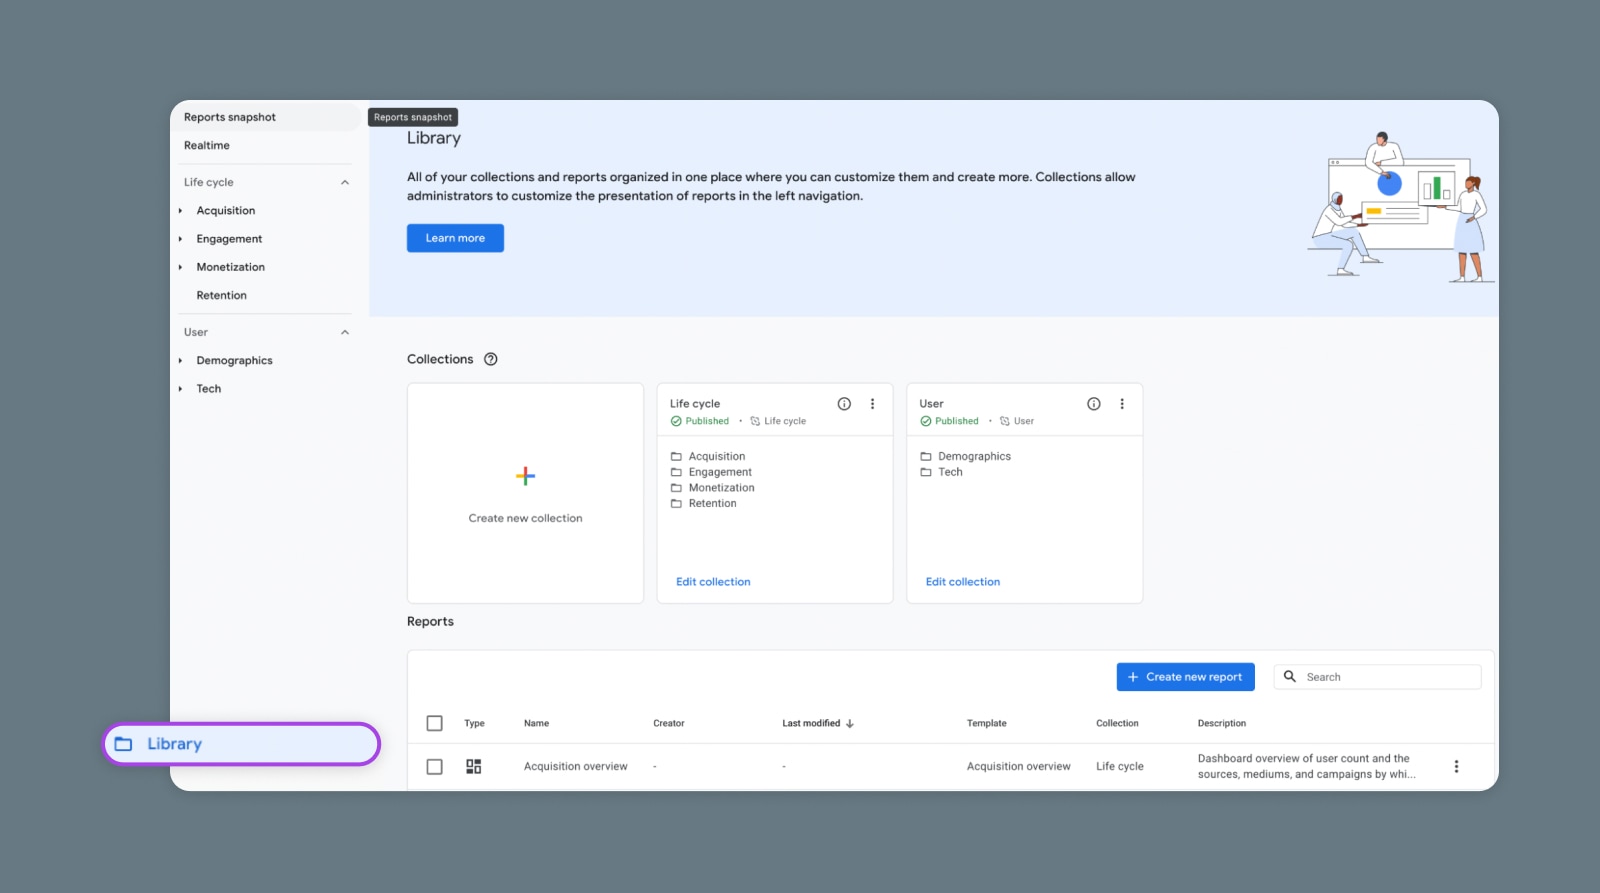
To create a unique report, just click “Library” at the bottom of the Reports tab menu.
You can even customize the standard report templates to get them to show data in just the way you like.
(Note: You’ll need Editor or Admin access to view the Library.)
Going Beyond the Reports Tab
Alright, so we’ve covered a ton of reports you’ll find in GA4. But, really, we’ve only scratched the surface of what kind of data you can compile and analyze.
Here’s a few additional things you may want to explore:
Explorations and Visualizations
One of GA4’s most popular new features is the Explorations tab.
Since we’re focused on the Report tab in this article, we won’t cover all of the details for how to use it. But, suffice to say that Explorations unlocks a whole new set of capabilities.
With GA4 Explorations, you can conduct free-form data analysis and build custom visualizations.
For instance, you can create a Funnel Exploration to help you better understand how users arrive on your website and then flow through it. You can also explore specific user paths with the Path Exploration and compare audience segments (including secondary dimensions!) visually with a Segment Overlap analysis.
Integrations
If you’re really ready to roll up your sleeves, your ability to build custom GA4 reports is only limited by your imagination (and your technical skills).
GA4 comes with a huge range of native integrations and can share data with most of the common Google products and other data analysis tools.
- GA4 integrates with Google Tag Manager for custom event tracking and conversions.
- GA4 integrates with BigQuery for advanced data analysis using SQL-like commands.
- GA4 can be linked with Google Search Console for SEO analysis and optimization.
That’s All GA4 Now, Folks
Hopefully you’ve found this review of GA4 reports helpful.
Although there’s some big changes from UA, getting used to the new version of Analytics will just take time. After a few months, you’ll be a pro who doesn’t think twice about pulling the perfect report from the data stream.
Until GA5 comes out….or whatever the heck they decide to call the next one.
Get More Visitors, Grow Your Business
Our marketing experts will help you earn more traffic and convert more website visitors so you can focus on running your business.